Dashboard
The page you land on after signing in (/dashboard; / is the public homepage
and redirects here once you are signed in). It's read-only orchestrator status
plus your organizations' credit balances, not project management yet.
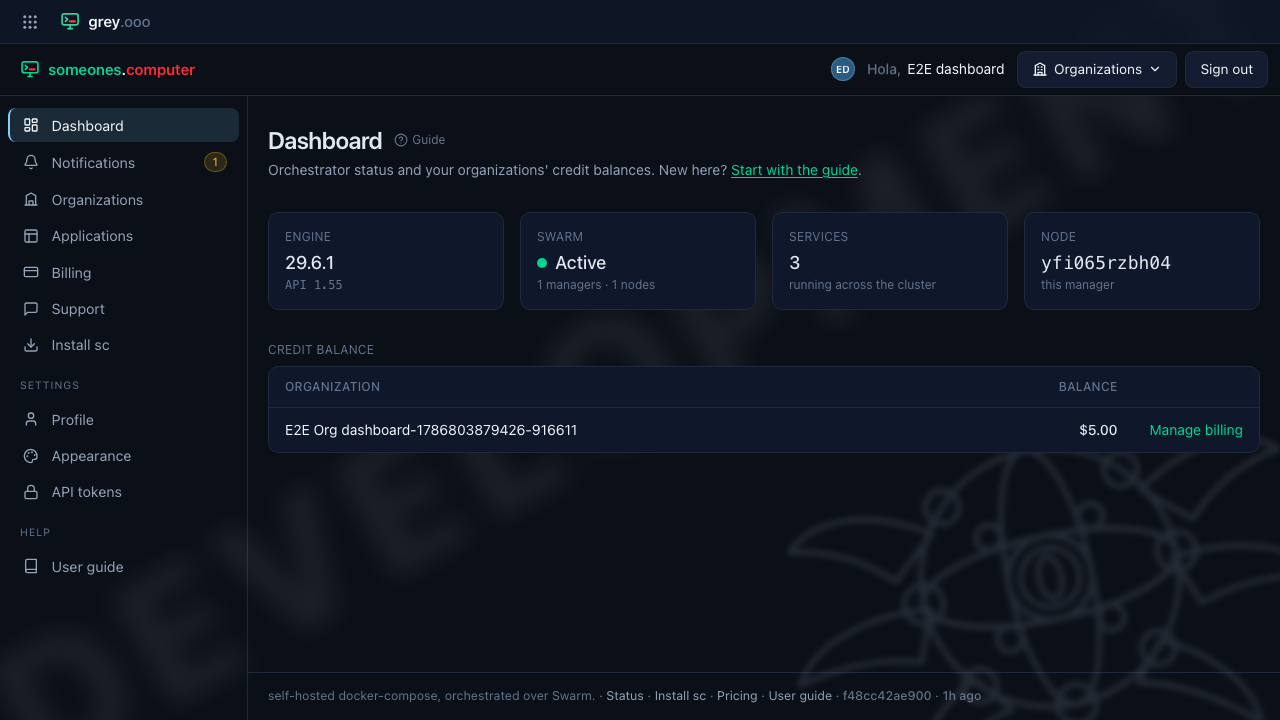
| Tile | Shows |
|---|---|
| Engine | Docker Engine version and API version |
| Swarm | Active/inactive, with manager and node counts |
| Services | Number of services running across the cluster |
| Node | This manager's node ID (truncated) |
All four come straight from the Docker Engine API on the host running the stack — there's no caching. If the daemon isn't reachable or isn't a swarm manager, the page shows an "Orchestrator status unavailable" banner instead of the tiles, rather than failing outright (see testing for what that means for running this suite locally).
Credit balances
Below the status tiles, a table lists every organization the signed-in user
belongs to, alongside its current credit balance (DashboardController::balances,
GET /dashboard/balances) — a manage-billing link per row, and a balance in the
red rendered amber, since an organization overspent cannot deploy. The table is
a Turbo frame (dashboard/_balances.html.twig) that live-updates over the same
Mercure hub as the rest of the control panel — a top-up clearing on Stripe's
webhook, or usage drawing the balance down, updates it without a reload. See
live-updates for the subscription mechanics.
What testing covers here
e2e/tests/dashboard.spec.ts asserts the four status tiles render after
sign-in. It exists as a Playwright test rather than a PHPUnit one specifically
because of that live Docker dependency — the PHPUnit suite mocks the Docker
client (see testing.md), so it can't catch a real Engine API response
shape changing underneath the template. Running it against the docker-compose
stack is what makes the check meaningful. The screenshot above is captured
during that same test run, not staged separately.